
NASA recently posted a video on their YouTube channel that for the most part went unnoticed. This video shows how the sea ice in the Arctic has been shrinking.
In this video, Dr. Walt Meier of NASA Goddard Space Flight Center goes over how the sea ice has gone through changes in recent times. Sea Ice grows throughout the fall and winter then melts throughout the spring and summer. That being said, not all of the sea ice melts, some of it survives throughout the melting seasons but in the past few years, even the oldest sea ice seems to be disappearing from the Arctic Ocean.
Climate.Gov actually reported as follows on the topic:
Replacing thick, multi-year ice with thinner, first-year ice is not an equal exchange when it comes to the roles sea ice plays in the heat budget, climate, and ecology of the Arctic. Younger, thinner ice permits more heat to escape from the ocean water into the atmosphere, raising Arctic air temperatures. It is also more easily fragmented and less able to dampen wave activity during winter storms, increasing coastal hazards from tidal flooding and storm debris. And because it is so much quicker to melt in the coming warm season, it leads to higher water temperatures in spring and summer, suppressing populations of commercially valuable fish.
First-year ice forms on open water, so the amount of open water in the Arctic at the end of the melt season is a strong driver of first-year ice extent the following spring. Arctic sea ice minimum extent in 2017 was the eighth-smallest on record—well below the 1981–2010 average, but not a record setter.
Sea ice generally exits the Arctic through the Fram Strait east of Greenland, and NSIDC reported that the low extent of multiyear ice may have been driven by a vigorous transport of sea ice during the 2017–2018 winter. The Beaufort Gyre north of Alaska has traditionally acted as a nursery for growing sea ice, but warmer conditions have impeded the gyre’s ability to preserve older ice since the start of the 21st century.
Throughout 2017 the trend of decline has been prominent in both the Arctic and Antarctic. Generally, older ice is much thicker but now that is not the case. The rapid decline in perennial sea ice is something we have noticed a significant change in as the years have been passing. As you will see in the animation below sea ice from the years of 1984 to 2016 the seasonal variability of the ice is changing from year to year.
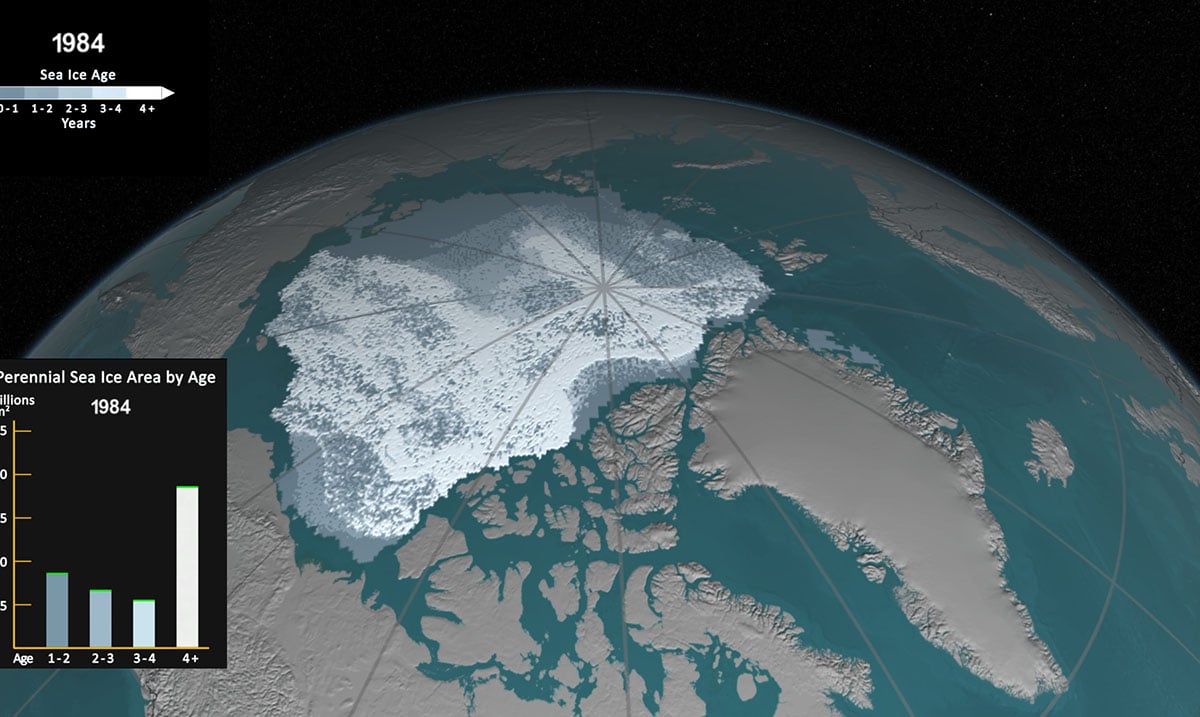
NASA wrote as follows on the visuals represented in this video:
Younger sea ice, or first-year ice, is shown in a dark shade of blue while the ice that is four years old or older is shown as white. A color scale identifies the age of the intermediary years.
A graph in the lower, right corner the quantifies the change over time by showing the area in millions of square kilometers covered by each age category of perennial sea ice. This graph also includes a memory bar – the green line that here represents the current maximum value seen thus far in the animation for the particular week displayed. For example, when showing the first week in September, the memory bar will show the maximum value seen for all prior years’ first week of September since the beginning of the animation (January 1, 1984).
With the year of 2017 itself bringing record highs for the Antarctic itself and 2016 being one of the hottest years we’ve seen, things are really warming up we do not know how things will progress. To hear Dr. Walt Meier go over this and see the animations noted above please feel free to take a peek at the video below. What do you think about all of this?
(Image Via: NASA)